3. Create a dashboard
Using dashboards allows you to build pre-defined searches on your data to always have everything important just one click away.
Introduction
This guide assumes that you have successfully completed and understood the sections before it. By now, you have log messages flowing into Graylog, and are familiar with the basic search and analysis functionality.
In comparison with saved searches, dashboards include a range of additional features. The main difference is the possibility to define widget specific search criteria like the query or the time range. More on this later. Dashboards also support creating multiple tabs for different use cases, displaying the result in a full screen mode and sharing with other people.
Create the base dashboard
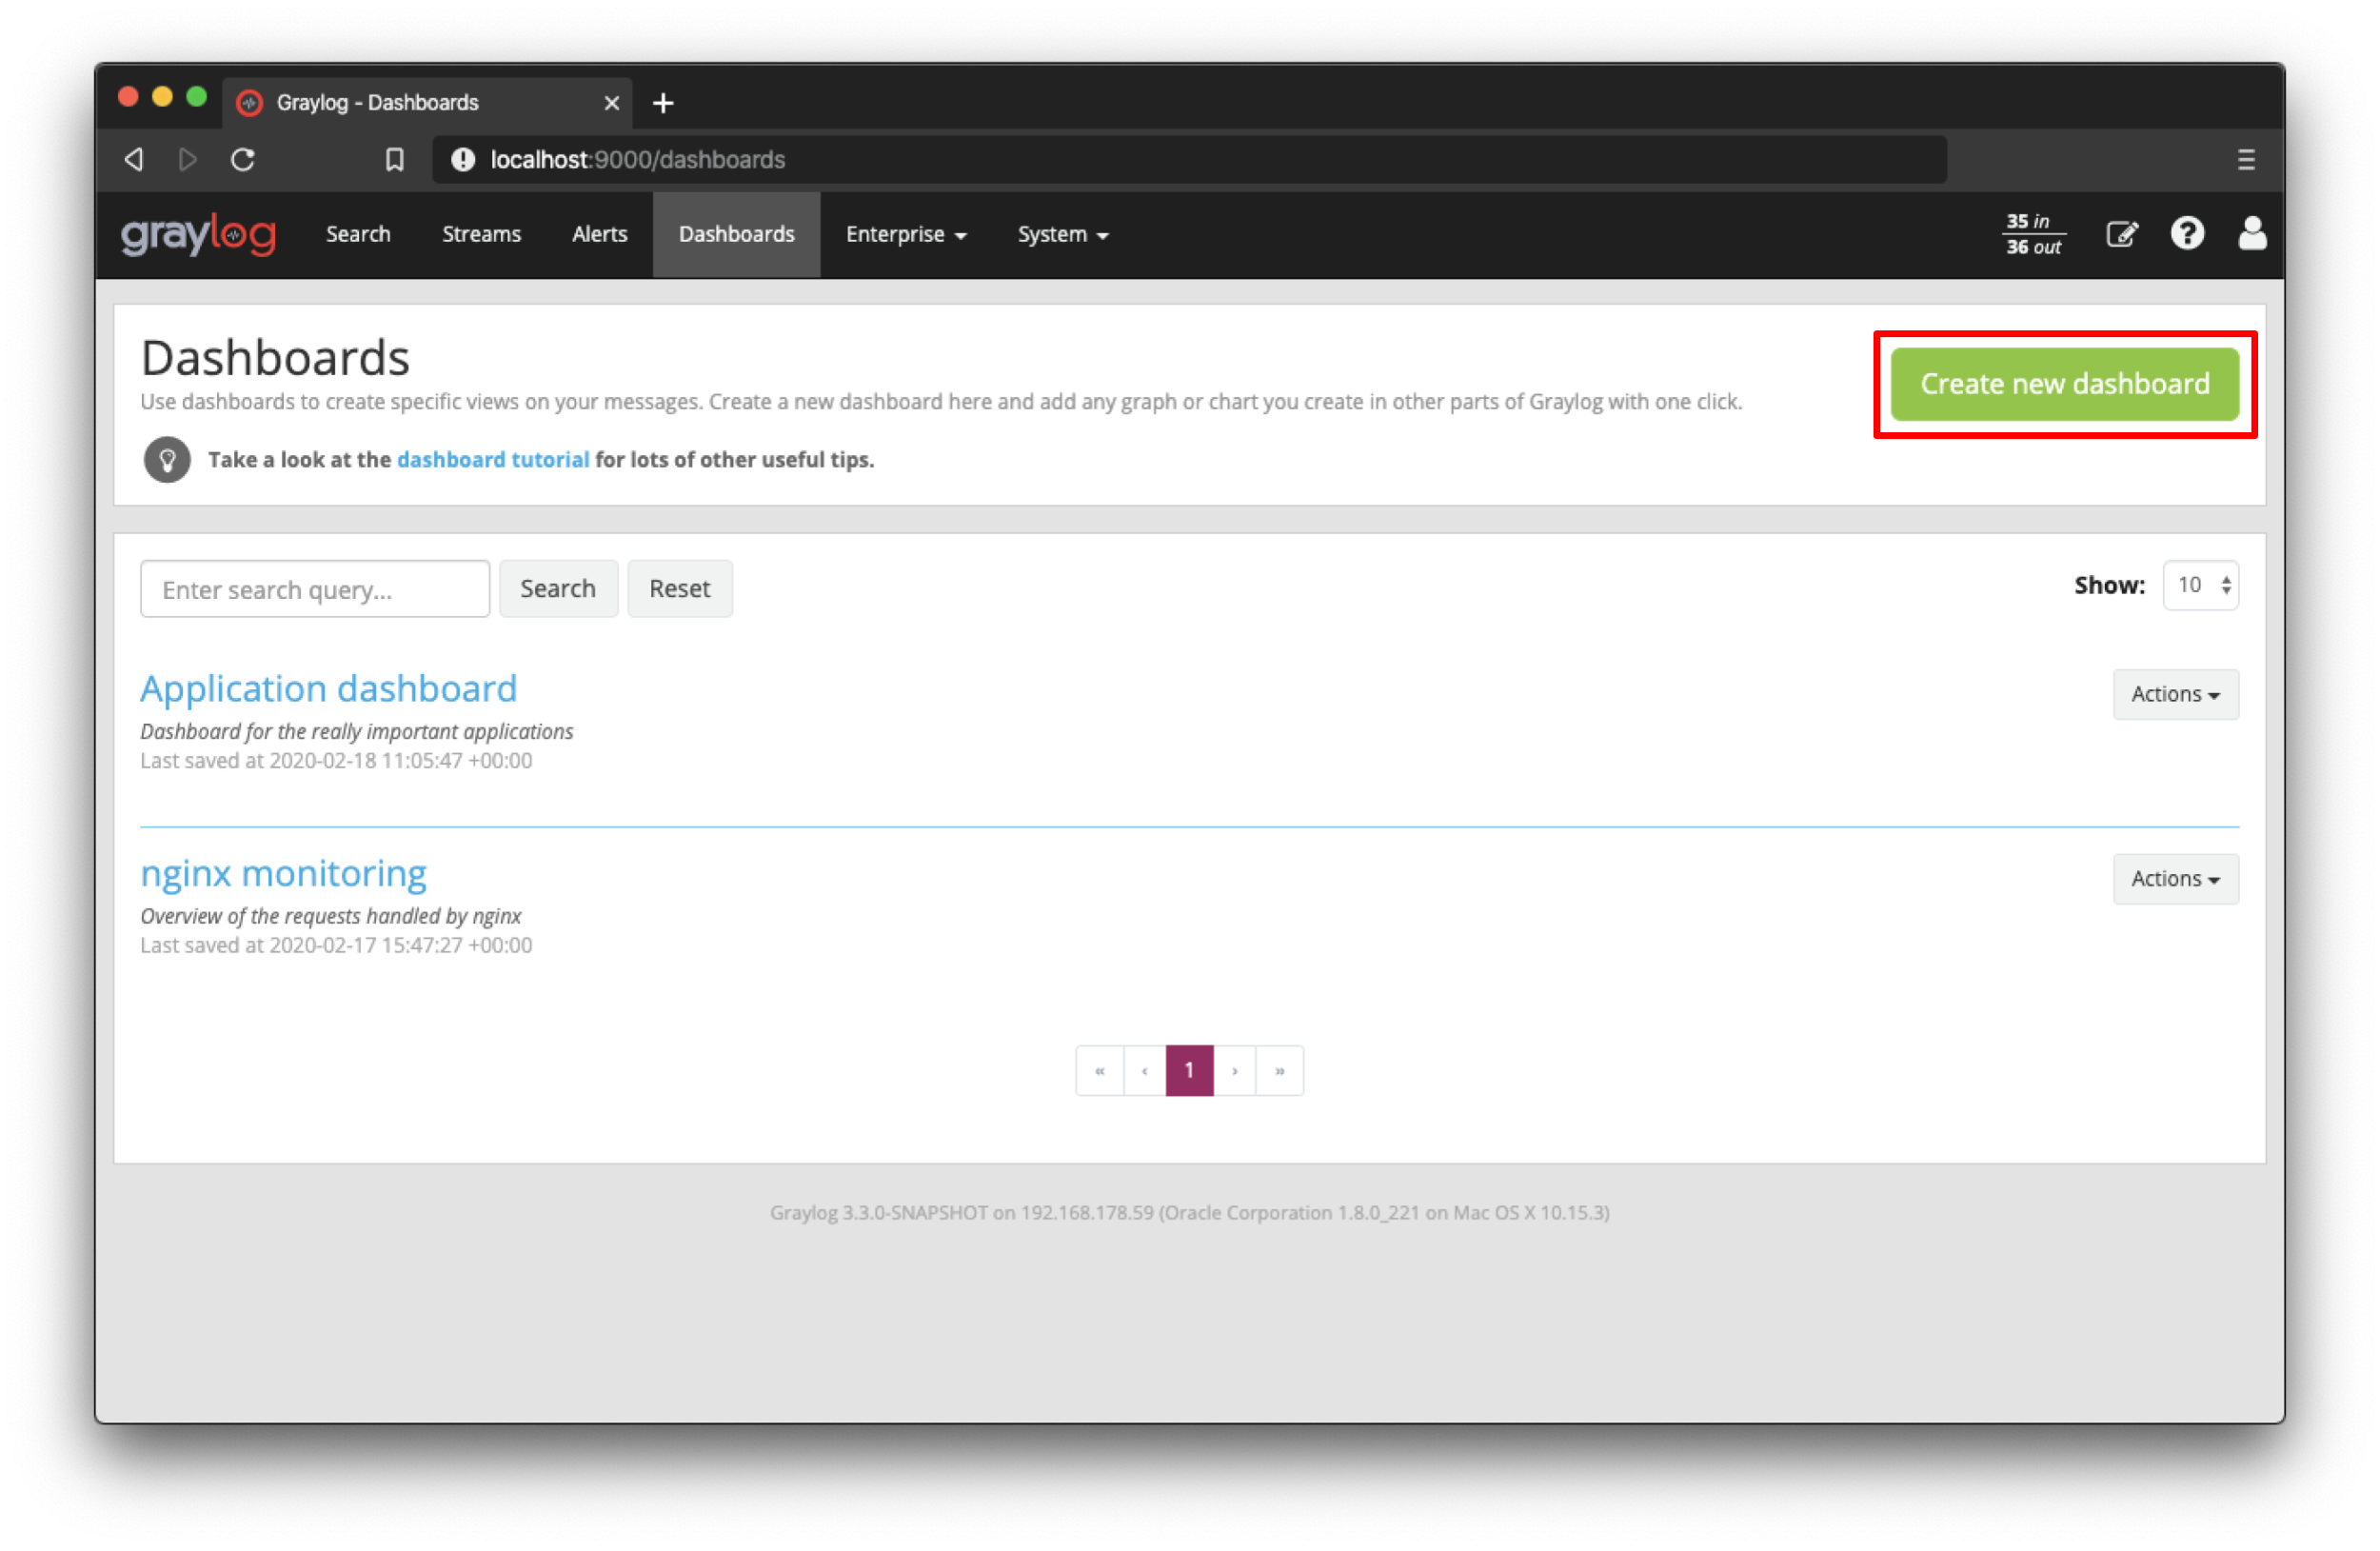
Navigate to the Dashboards section using the link in the top menu bar of your Graylog web interface. The page is listing all dashboards that you are allowed to view. Hit the Create new dashboard button to create a new empty dashboard.
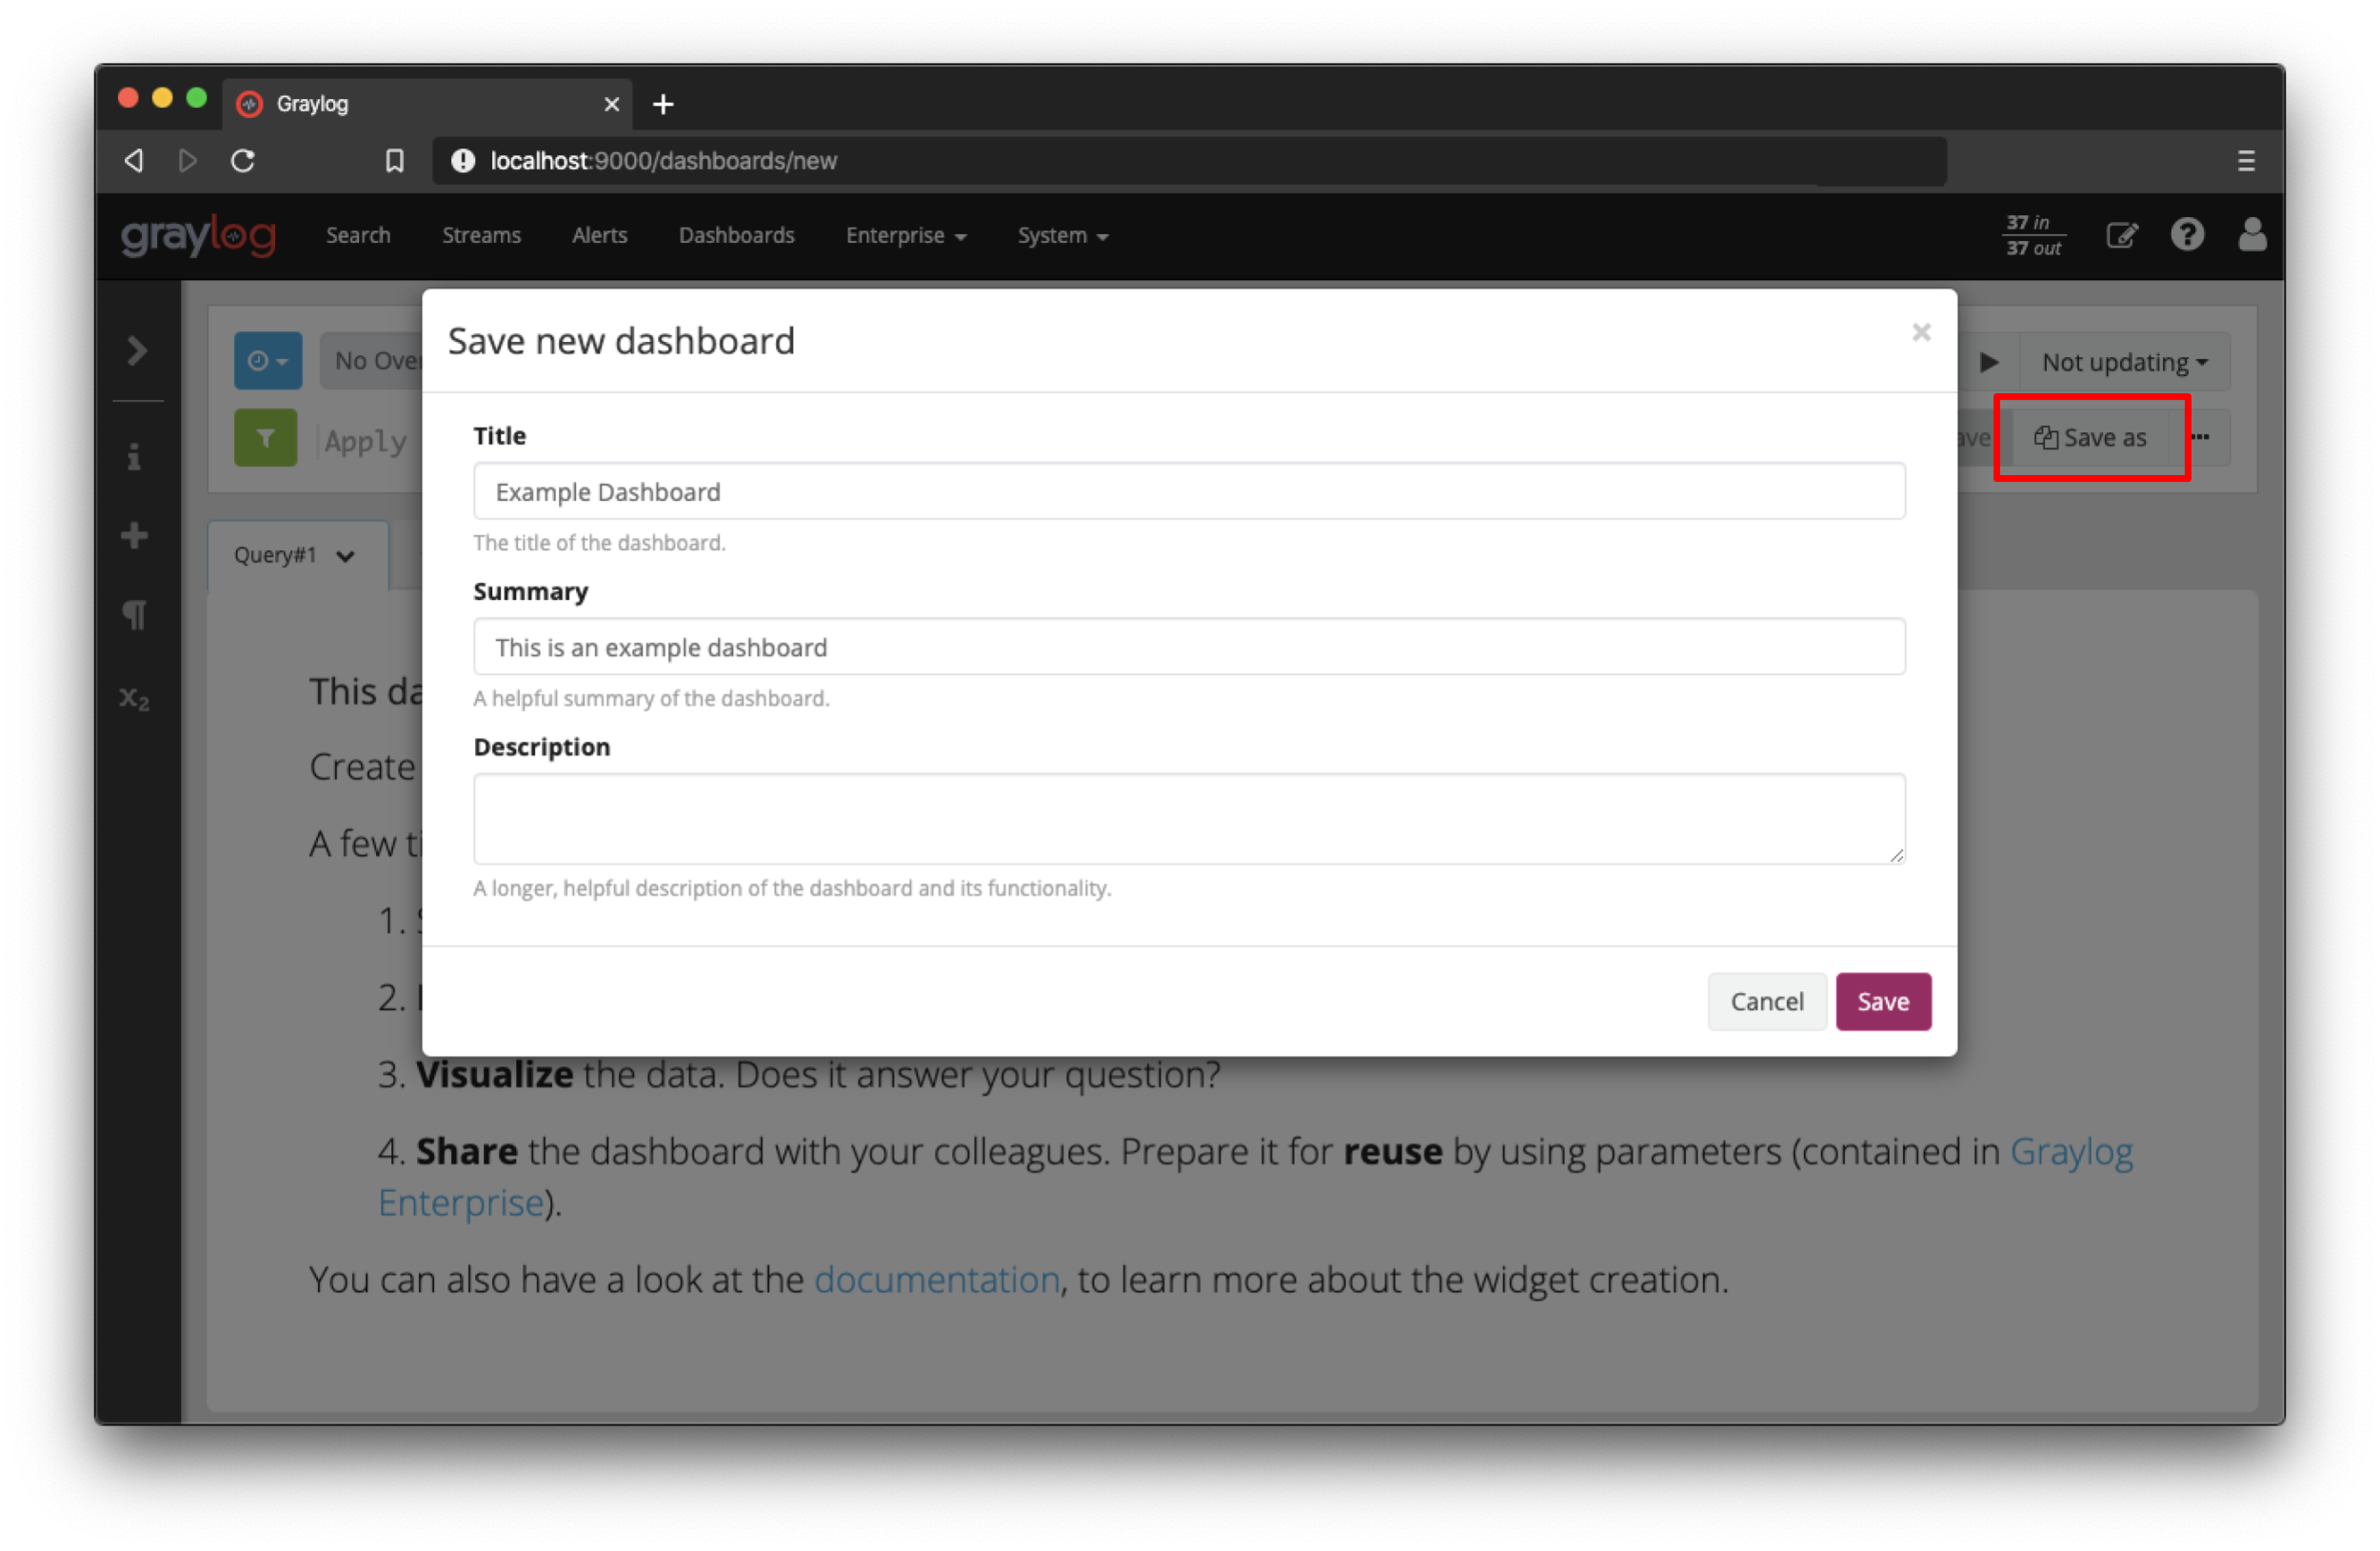
You should now see your new dashboard. Hit the Save as button on the right side of the search bar to save the dashboard.w
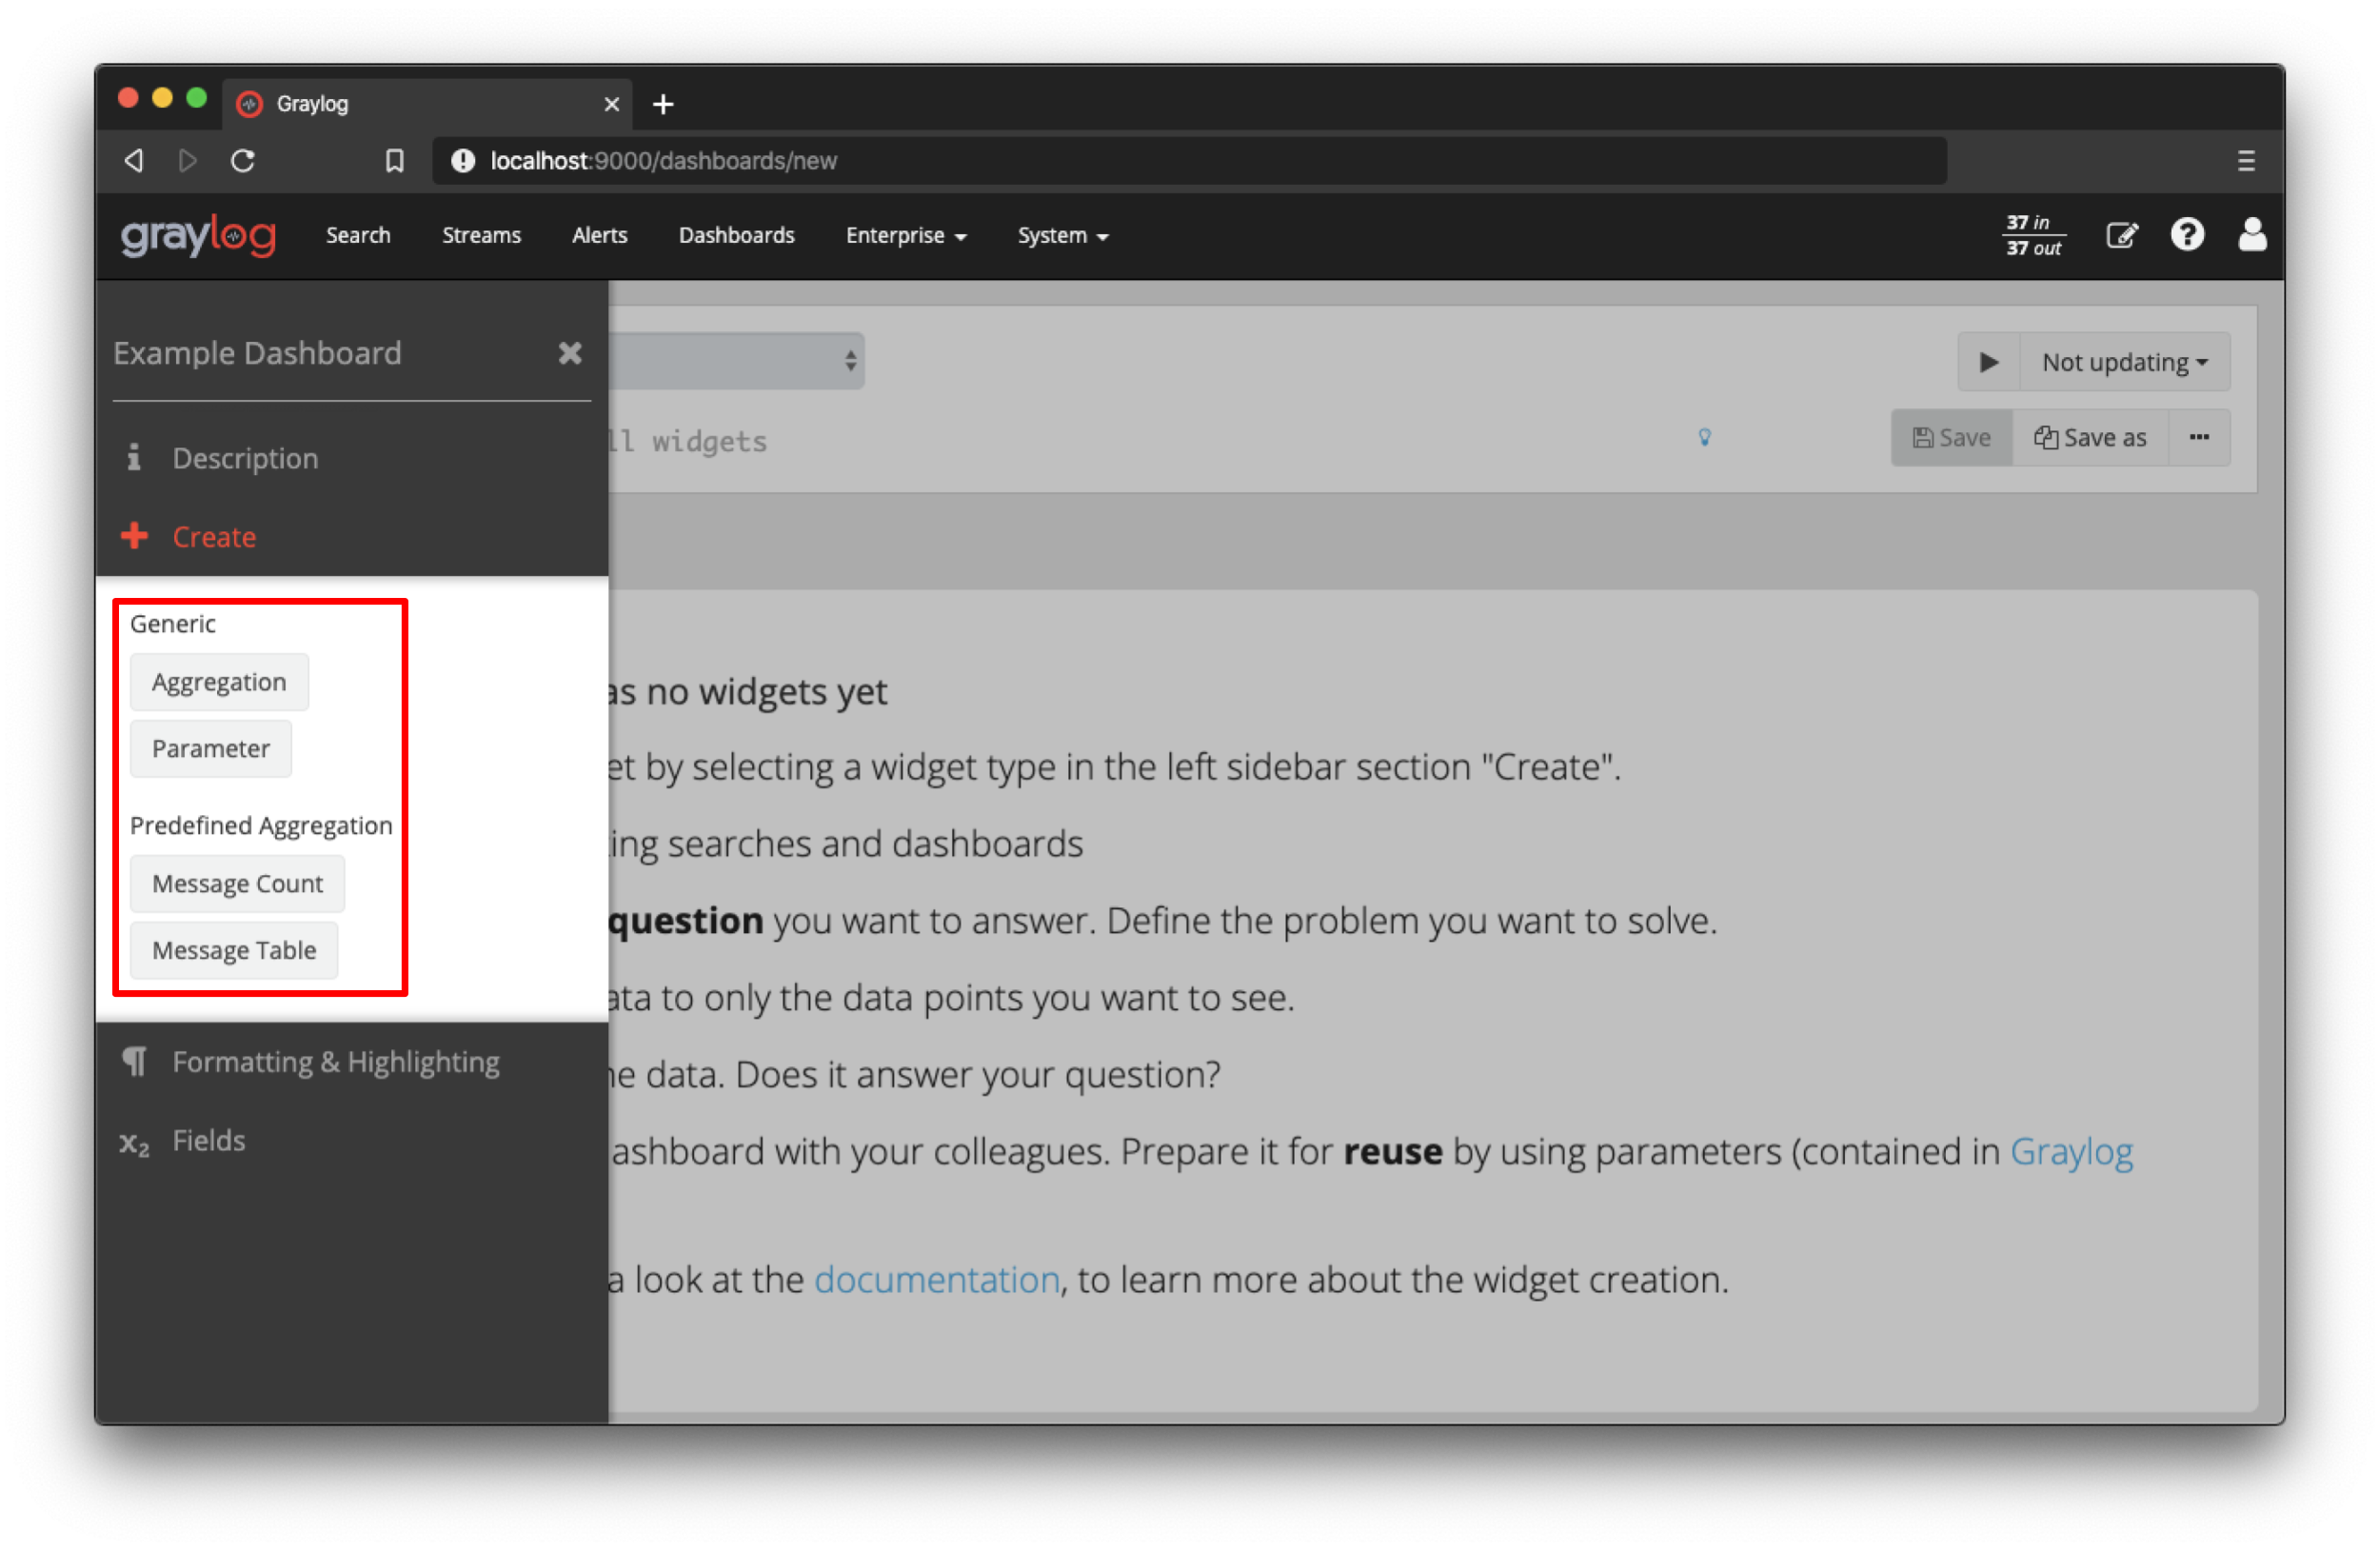
Add widgets to the dashboard
Let’s add some widgets! You can add search result information to dashboards with a couple of clicks. In the last section you have already learned how to visualize your search results with widgets. Good news, you can add widgets to you dashboard in the exact same way. Have a look at the Widgets page in the documentation for a more detailed description of different widget types and how to create them.
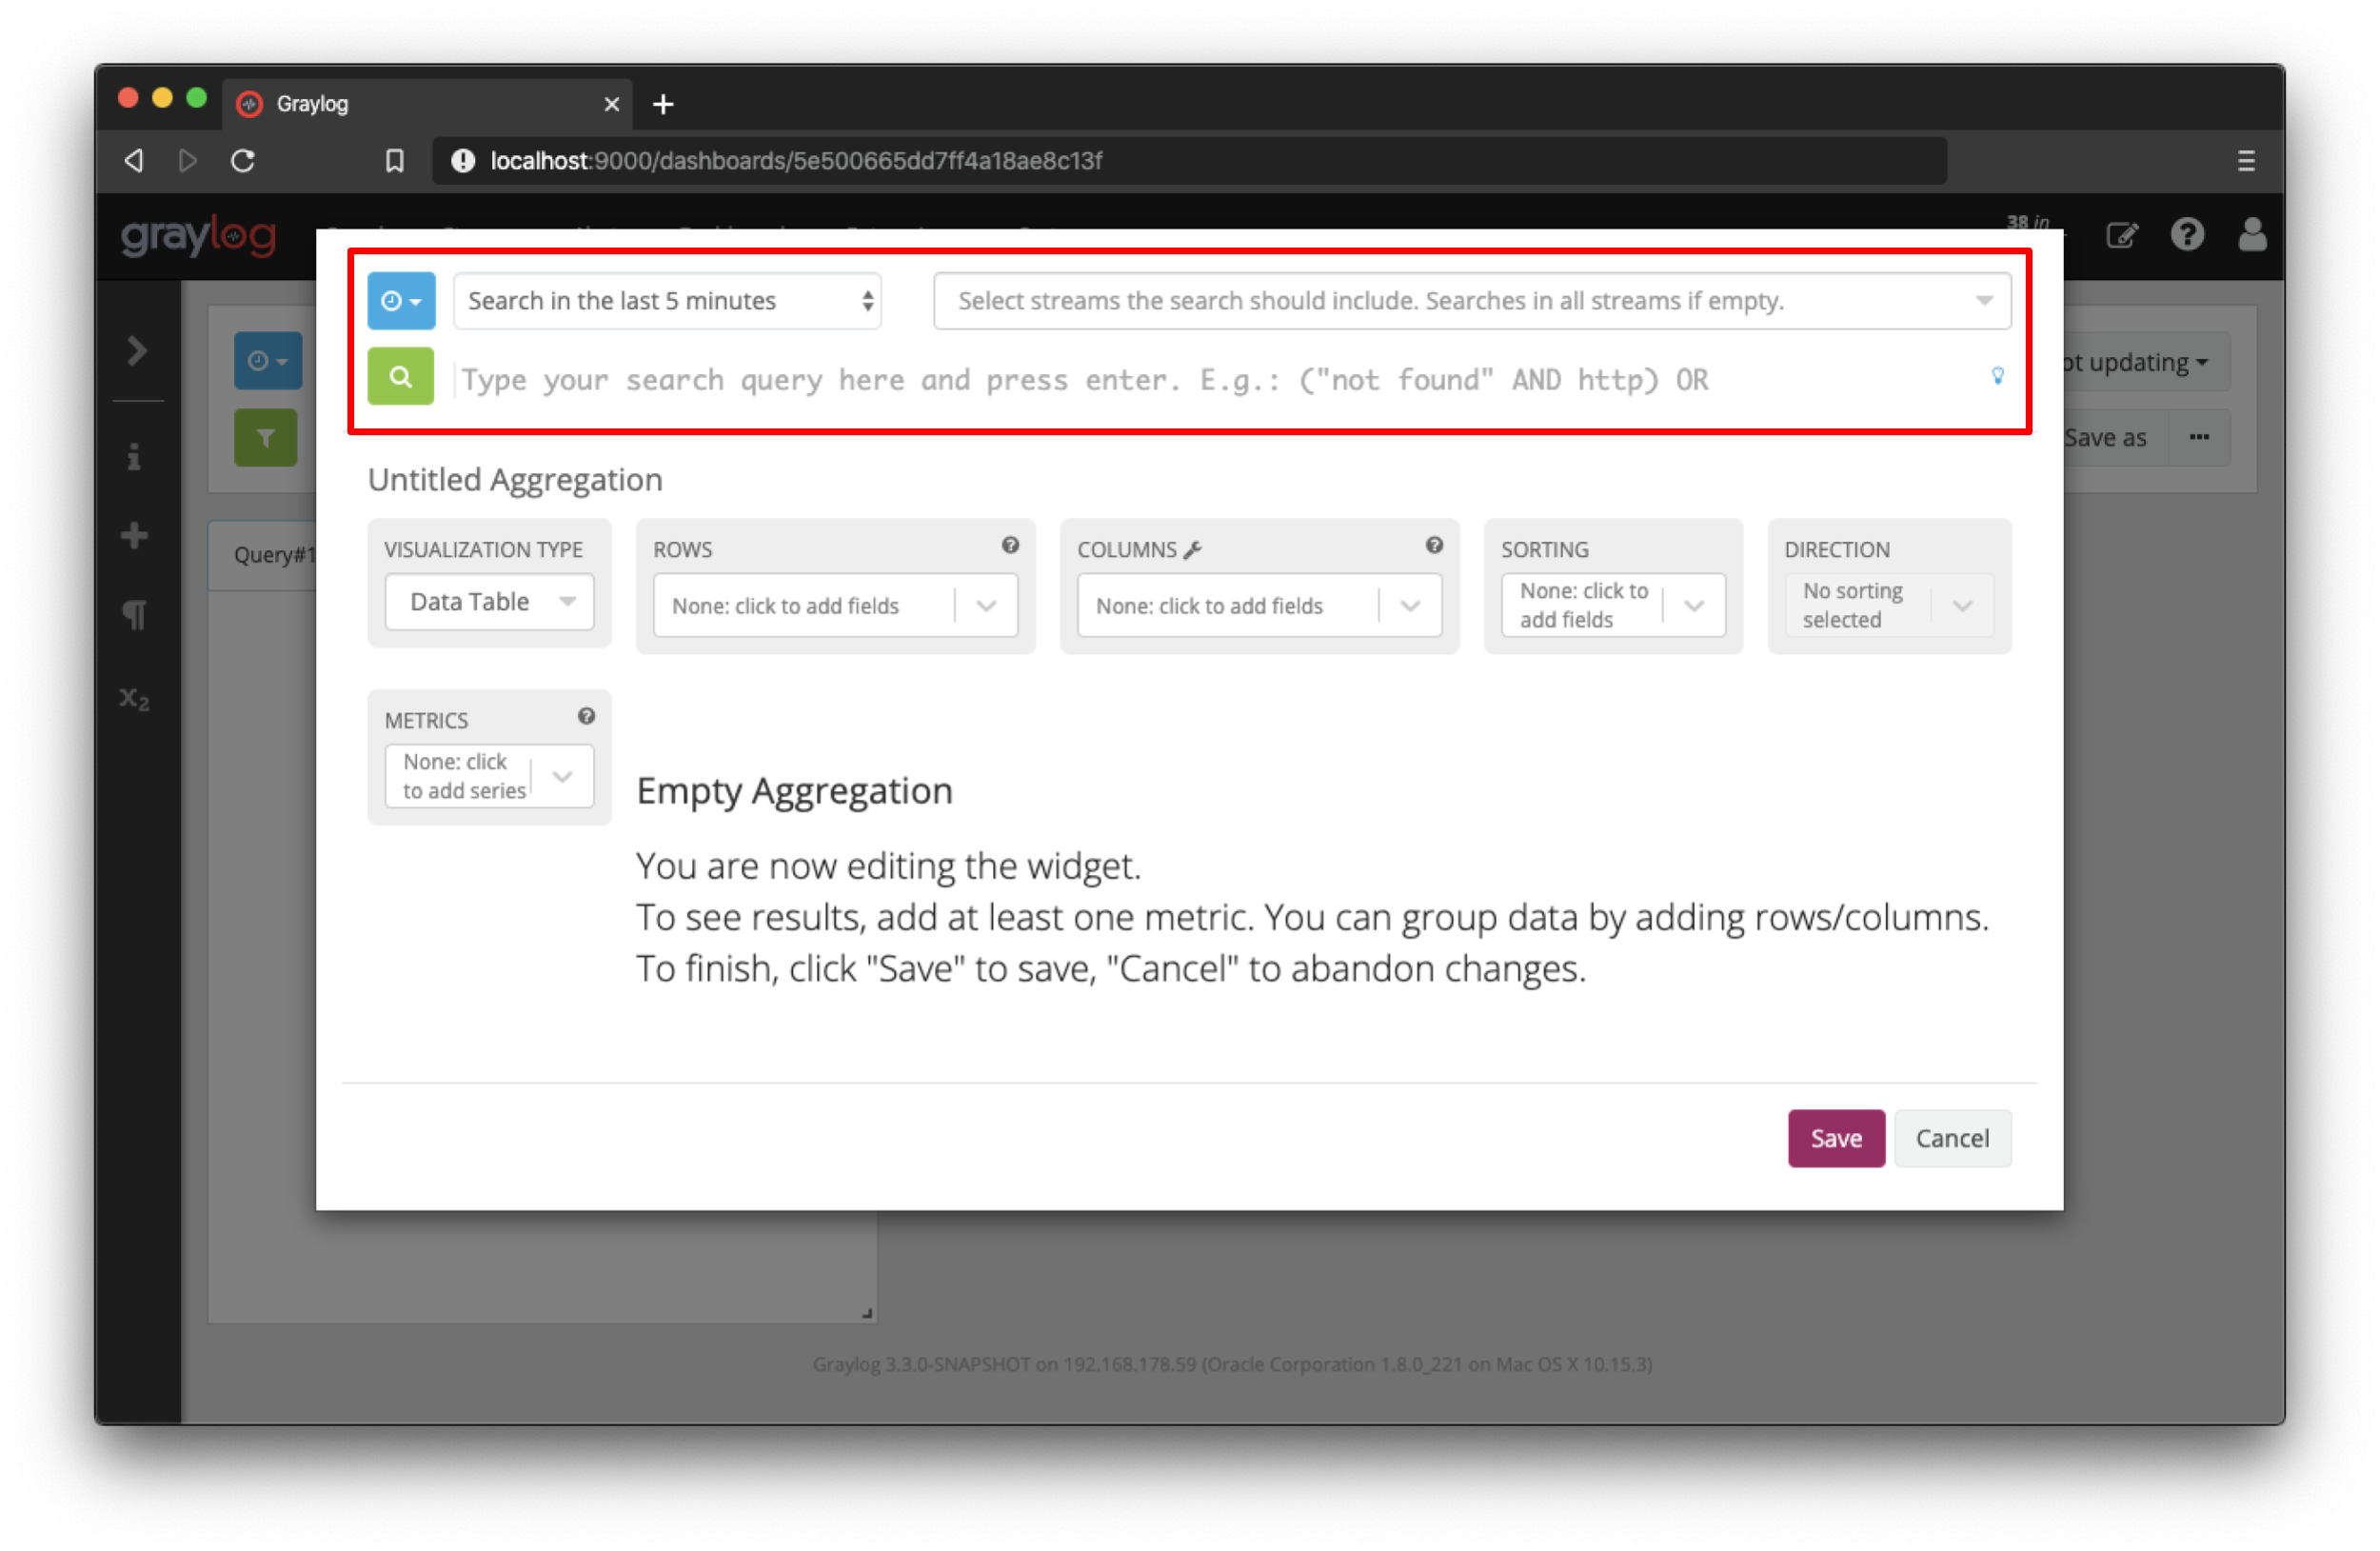
Difference between the main search and dashboards
As described in the introduction the main difference between dashboards and saved searches is the possibility to define widget specific search crtieria. This includes the time range, search query and stream selection. These options can be defined using the search bar inside the widget edit modal.